Neurology. 2015 Jan 27;84(4):367-73.
Cervical cord lesion load is associated with disability independently from atrophy in MS.
Abstract
OBJECTIVE:
To investigate whether spinal cord (SC) lesion load, when quantified on axial images with high in-plane resolution, is associated with disability in multiple sclerosis (MS).METHODS:
Twenty-eight healthy controls and 92 people with MS had cervical SC 3T MRI with axial phase sensitive inversion recovery, T2, and magnetization transfer (MT) sequences. We outlined all visible focal lesions from C2 to C4 to obtain lesion load and also measured upper cervical cord area. We measured MT ratio in normal-appearing cord tissue and in lesions. Disability was recorded using the Expanded Disability Status Scale (EDSS) and MS Functional Composite. We used linear regression models to determine associations with disability.RESULTS:
SC lesion load was significantly higher in both secondary progressive MS (SPMS) (p = 0.008) and primary progressive MS (PPMS) (p = 0.02) compared to relapsing-remitting MS (RRMS); in each comparison, adjustment was made for age, sex, and brain volume. These differences were not evident when EDSS was added as a covariate. SC area was significantly lower in both SPMS (p < 0.001) and PPMS (p = 0.009) compared to RRMS. In a multiple regression model, cord lesion load (p < 0.001), cord area (p = 0.003), age (p < 0.001), and sex (p = 0.001) were independently associated with EDSS (R(2) = 0.58). Cord lesion load (p = 0.003), cord area (p = 0.034), and brain parenchymal fraction (p = 0.007) were independently associated with the 9-hole peg test (R(2) = 0.42).CONCLUSIONS:
When quantified on axial MRI with high in-plane resolution, upper cervical cord lesion load is significantly and independently correlated with physical disability and is higher in progressive forms of MS than RRMS.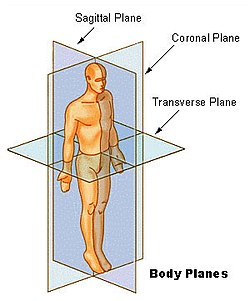 This work is dedicated to understanding the DIRECT role/contribution of spinal cord pathology to disability in MS. The authors will tell you that this has not been done before (am I hearing this correctly?). In fact, there is a modicum of truth to their assertions; previous studies analyzed sagittal images (see diagram) - this does not fully account for the cross-sectional involvement of the spinal cord by lesions, or when lesion counts were performed on the transverse plane (see diagram) their size was not accounted for. Incomplete science can lead to half-truths or cherry-picking and suppression of the truth intentionally or unintentionally.
 What made me pick up this article was the title, that cord lesion load is more relevant than brain atrophy (i.e. volume loss). In their statistical model they found that only cord lesion load, cord area, age and sex independently associated with EDSS. On balance, I don't think that this alone is enough to dump all the other MRI studies which have been studiously looking at various forms of brain atrophy. I'm afraid the truth probably lies some where in between, and based on this study alone I will not be adding spinal cord evaluation to my routine scanning, year in, year out.
Also, included in the full article is an interesting table (see below) that is worth discussing today (take a few minutes to look through the figures in the table). Points to note: 1) PPMS is a different entity to that of RRMS and SPMS; 2) There is inflammatory activity in SPMS and PPMS; and 3) by SPMS >1/4 of the spinal cord is lost. These are three major points to consider when designing clinical trials in progressive MS.
Table: Unadjusted mean of MRI parameters analyzed in controls and each subtype of MS
| Controls (n=28) | RRMS (n=34) | SPMS (n=29) | PPMS (n=29) | |
| Upper cervical cord lesion load, mm2 | 8.10 | 16.68 | 13.2 | |
| Upper cervical cord cross-sectional area, mm2 | 79.59 | 76.79 | 63.64 | 69.33 |
| % spinal cord area covered by lesions | 11.1 | 28.4 | 19.3 | |
| Whole cord MTR | 49.7 | 47.75 | 45.59 | 46.48 |
| Normal-appearing spinal cord MTR | 49.7 | 48.31 | 46.56 | 47.51 |
| Spinal cord lesion MTR | 43.37 | 40.54 | 41.26 | |
| Brain parenchymal fraction | 0.823 | 0.811 | 0.788 | 0.799 |
| Brain T2 lesion volume, ml | 13.00 | 23.34 | 16.57 |